Vogel diagrams / Global-Controls-and-Header-Bar.html
V07: Main volume and visualizer
Retained analysis
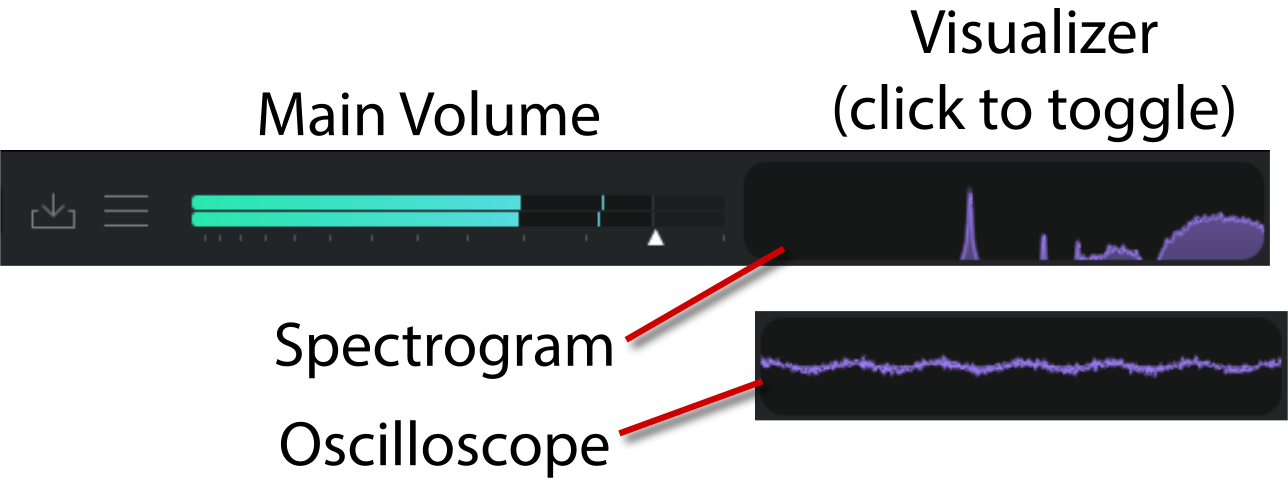
The header visualization toggles between a waveform trace and a frequency plot. The annotation calls the latter a spectrogram, but no time-history axis is shown. Use it for immediate visual feedback, not a saved time-frequency measurement or proof that a transient has disappeared. The master slider is a separate control.
Documentation and visible configuration; not a new native audio test. Project observations are distinct from the source author's claims.
Provenance
{
  "id": "V07",
  "source_sha256": "44e1a224d70e44cf2a7d3c5373ecde952052561ba5c588f840a31eb5f64006d0",
  "render_sha256": "c7ed862387a78f4ff06aa85a445aaafc24aedc4d05d793e4d68aaf07ac099034",
  "original_sha256": "5582aa8510fdfcc4ff3d3d4b4cea33829b21fbd316ff43b5c4e46120e0f4eb51"
}