Vogel diagrams / Effects.html
V45: Compressor effect
Retained analysis
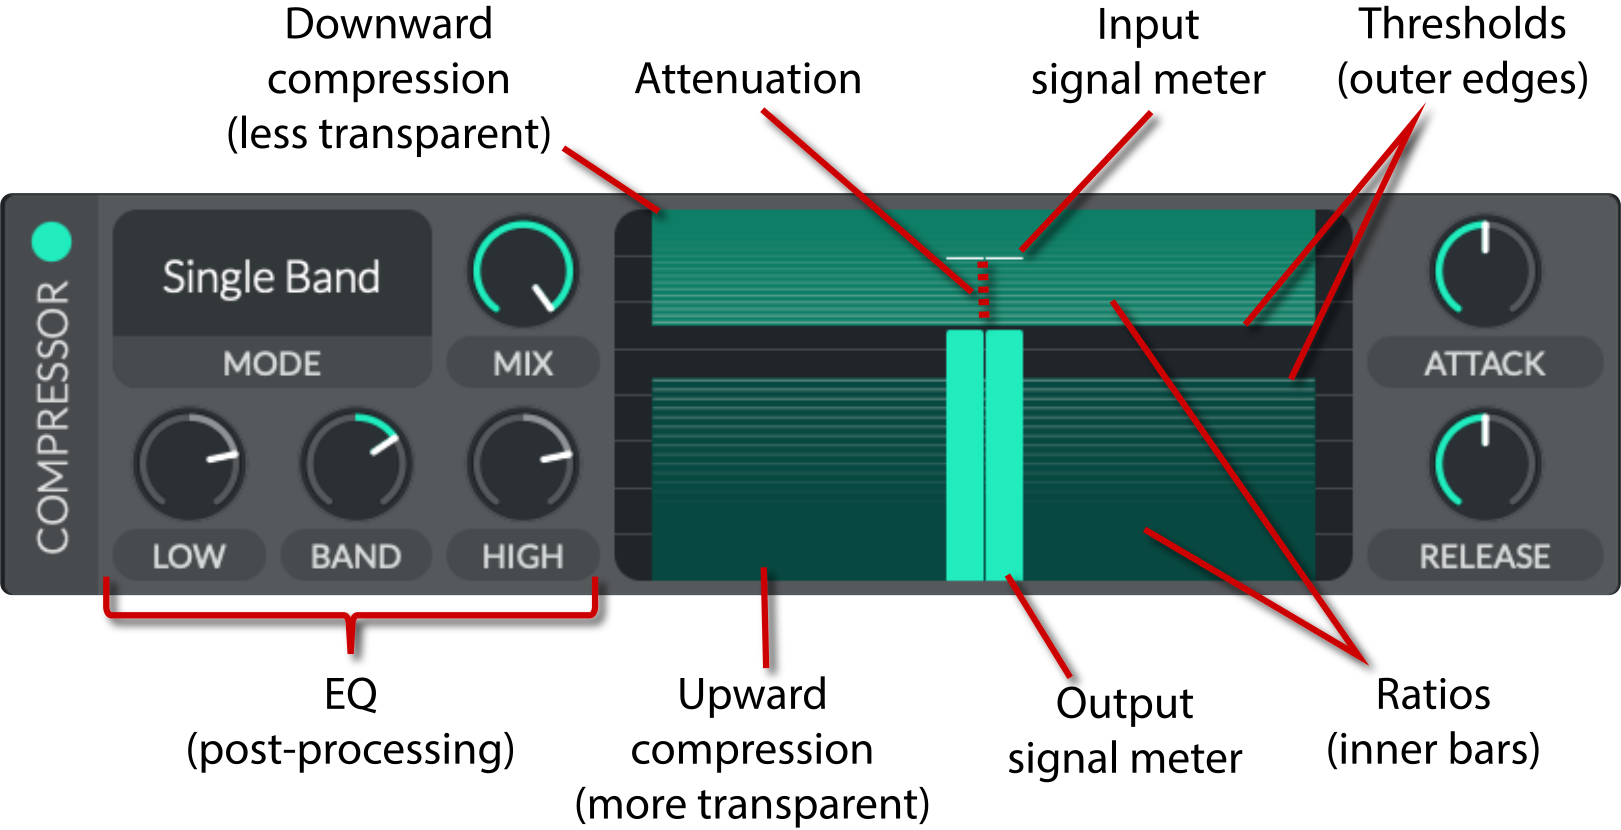
The compressor's outer graph edges are thresholds and inner bars are ratios; the central bars show input/output and attenuation. Upper/lower regions control different level behavior; attack/release and band gains are separate. The figure's "more transparent" description of upward compression is contextual, not a rule that it is always less audible or improves a match.
Documentation and visible configuration; not a new native audio test. Project observations are distinct from the source author's claims.
Provenance
{
  "id": "V45",
  "source_sha256": "519e93c81ec0bee385339a61add29e0ff8625e51b394c58bb2beb03513cb7664",
  "render_sha256": "f44d3b4b58d1dbd876f9691ee1b12e0547594bfe2eea7160d4d6ebb276da65c1",
  "original_sha256": "6f9a019b38f7ca09c3f72af5a083c48b27b47acd777ba8f0b2bfdecfd6631a31"
}